How to use Stocks Live to track winners?
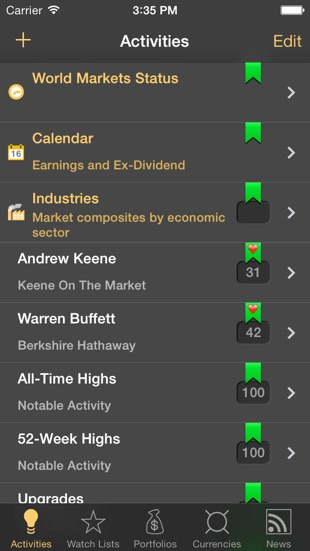
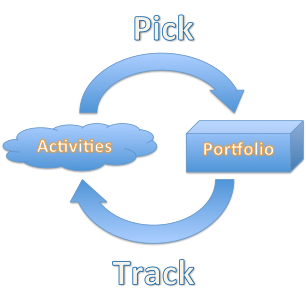
In the previous RSS feed, “How to use Stocks Live to find winners”, we learned that the Activities tab is the first step to finding winners. To track them (or sell if we need to), we depended on the constant news reading, chart browsing, alerts on earnings or event, etc., but there is a missing link we didn’t talk about. We are talking about a quick way to decide the health of your portfolio. Do you own a stock that is in the Activity “Stocks in a New Downtrend”? You may need to sell. Do you own a stock in the Activity “Breakaway Gap Ups”? Hold on tight. We realized that the Activities tab is great in giving you hints on what to buy, but it is not used much for tracking. We believe we found a brilliant way to track your current holdings using the same Activities that got you there in the first place. We connected your Portfolio holdings with the Activities through the ❤ symbol. For example, if you find ❤ in a bearish activity, then pay attention because one of your stocks is heading downhill; on the other hand, if you find ❤ in the bullish activities then relax and enjoy the ride (or buy more). We made it easy using the Heat Map to find this heart, but you needed to tap on every activity in order to find that heart; well, in version 2.6 we solved this issue. You can see the heart right there on the front page of the Activities, without tapping to check individual stocks!
We hope that you enjoy this innovative touch and that it will make you more money.


Stocks Live Team,
